Jakub Dariusz Bronik, Michael Buck, Jörg Starflinger
Institute of Nuclear Technology and Energy Systems (IKE), University of Stuttgart Pfaffenwaldring 31, 70569 Stuttgart, Germany
Summary
Supercritical fluids, such as water or CO2, have promising properties for advanced nuclear reactor systems. For the safety assessment of thermohydraulic systems using these fluids, a deep understanding of heat transfer in the trans-critical pressure range is crucial, especially during startup, shutdown, or loss-of-coolant accidents. Despite extensive research at reduced pressures below
𝑝⁄𝑝crit = 0.7, data above this ratio up to the pseudocritical pressure is limited. A comprehensive experimental study was conducted at the SCARLETT facility, focusing on critical heat flux (CHF) and post-CHF heat transfer characteristics of CO2. Two 2-meter-long tubular test sections with 6 and 10 mm diameter and detailed instrumentation yielded results under vertical upward flow conditions, providing data for dryout and departure from nucleate boiling mechanisms, CHF limits, and post-CHF heat transfer coefficients.
Keywords
CHF, dryout, post-CHF, boiling, DNB
Introduction
In supercritical thermal cycles, pressure variations can cause transitions between supercritical and subcritical states. Reliable heat transfer models for both states are crucial for safety design and analysis. Heat transfer in the subcritical pressure state, including post-CHF heat transfer, has been studied very intensively in the past for reduced pressures up to 𝒑⁄ 𝒑𝐜𝐫𝐢𝐭 ≤ 𝟎. 𝟕 (ratio referred to as 𝒑𝐫), also because of its importance in light water reactors [1]. There exists a large number of models or correlations developed for this pressure range.
However, studies of heat transfer under subcritical pressure conditions in near-critical range 0.7<𝒑𝐫<1 have been scarce [2], and correspondingly the theoretical prediction models lack validation and are only applicable for a limited range of conditions. E.g., analysis of the transient processes in a 4-rod bundle with water cooling showed that the thermohydraulic system code ATHLET (Analysis of THermal- hydraulics of LEaks and Transients) cannot satisfactorily predict heat transfer in thise high-pressure range [3]. The experiment showed that during the transient process with decreasing pressure from 25 MPa to 17 MPa, a sharp increase in wall temperature occurs at a pressure of about 21 MPa. This corresponds to the appearance of the boiling crisis, which, however, was not predicted by the ATHLET code.
To improve the knowledge about the physical processes of heat transfer at subcritical pressures near the critical point and in the adjacent post-CHF range, the joint CPC-HD project was set up to carry out experimental and theoretical investigations at three different German universities using three different working fluids. The present paper concentrates on the experimental part of the project with CO2 as a working fluid carried out at University of Stuttgart.
Experimental Setup
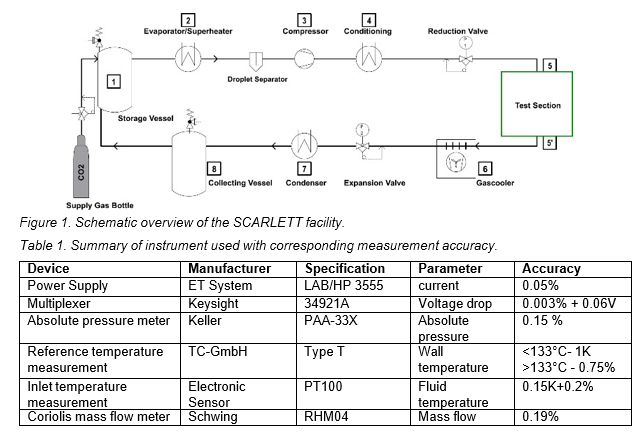
All experiments presented in this publication were carried out in the SCARLETT (Supercritical Carbon dioxide Loop at IKE Stuttgart) test facility at IKE. SCARLETT works as a peripheral facility used to provide CO2 under defined parameters: mass flow rate, temperature, and pressure near the critical point. Detailed information about SCARLETT is available in Flaig et al. [4]. While SCARLETT has been used in the past mostly to work at supercritical pressure, the facility has been modified for the present experiments to safely operate in subcritical pressures. This was achieved by the implementation of a reduction valve upstream of the test section. A schematic overview is presented in Fig. 1.
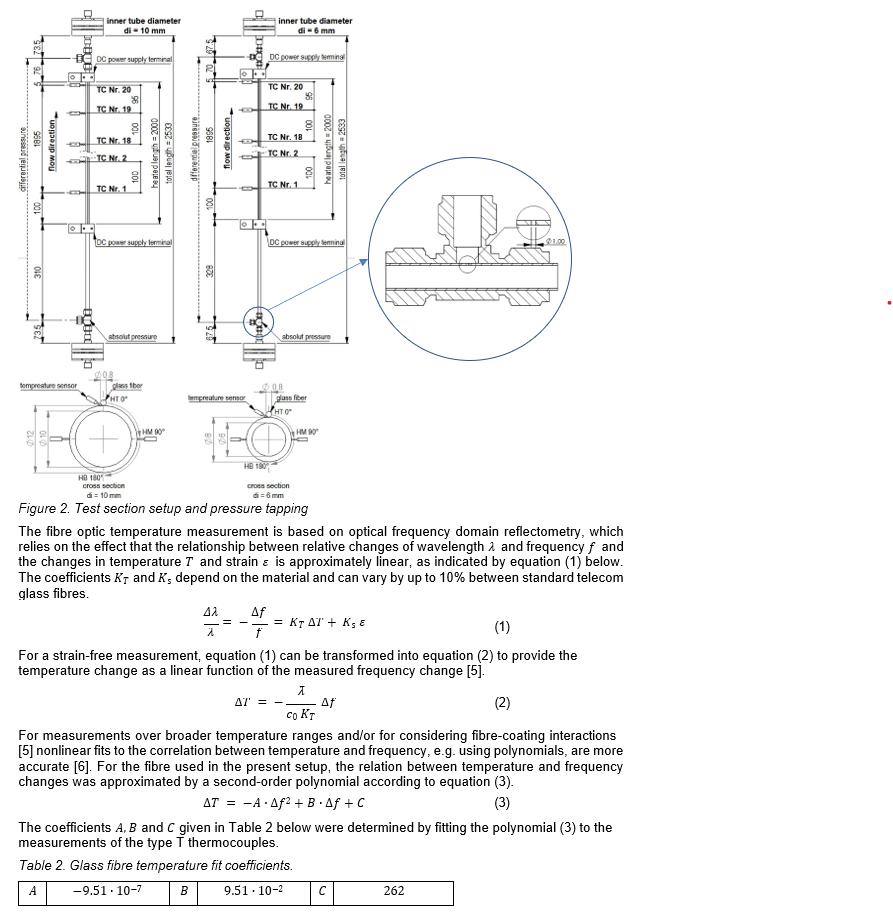
For the investigations presented in this publication two different test sections have been used which are shown in Figure 2. The test sections were operated in parallel, allowing for adjustable mass flow rates by diverting flow between them. The test sections have the same structure, the only difference is the diameter of the tubes. The test tubes are heated directly with a 35 kW DC power supply. To insulate the test rig electrically from the test tubes, special insulating flanges are used. The mass flow rate and bulk temperature of the CO2 are measured just before the entry into the test sections.
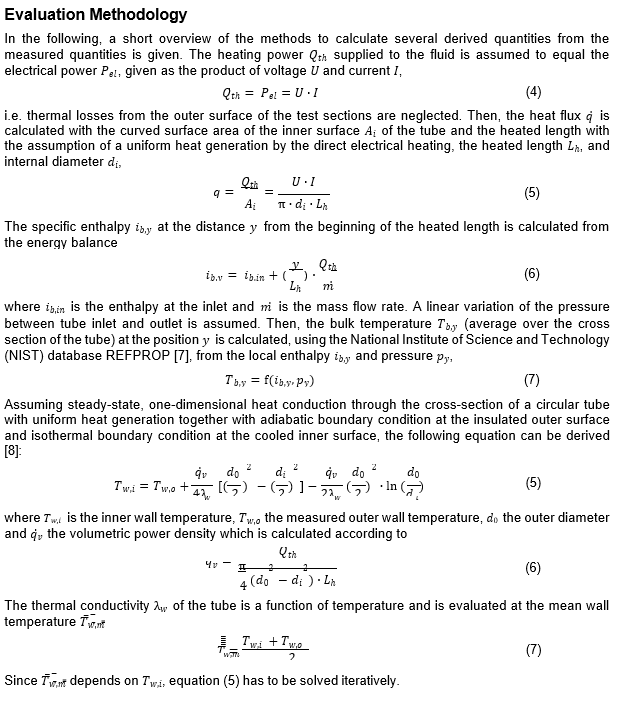
Fig. 2 shows the dimensions of the test tubes with an inner diameter of 6 and 10 mm and an outer diameter of 8 and 12 mm. The material of the tubes is Alloy 625. The total length of the test tubes is 2533 mm with a heated length of 2000 mm. The tubes are instrumented with a glass fibre in a stainless- steel capillary for temperature measurement. As a reference and for calibration purposes, 20 T-type thermocouples are tied with a temperature-resistant yarn in 100 mm distance from each other on the outer surface of the test tube adjacent to the capillary. Both thermocouples and capillary have been electrically insulated from the pipe with a 200 µm thick mica paper layer. The absolute pressure is measured before and after the heated section and the differential pressure is measured over the heated length. The pressure inside the test tube is measured through a 1 mm hole to avoid influencing the flow
– the setup can be seen in Figure 3. The accuracies of the instrumentation as provided by the manufacturers are given in Table 1.
Results
The test section, as outlined in the experimental configuration, was utilized for the investigation of Critical Heat Flux (CHF). CHF refers to the point at which the direct contact between the liquid and the heated wall is lost, leading to a significant reduction in heat transfer. CHF experiments started from well-defined steady-state conditions at a heating power sufficiently below the critical power. Steady-state conditions were assumed to be established when the criteria of pressure fluctuations less than ±0.02 MPa and inlet temperature fluctuations less than ±0.2 °C were met. Then, the heating power was increased by changing the voltage in steps of 0.1 V. Between steps, the power was kept constant over intervals of about thirty seconds. When the imposed heat flux remains constant, the boiling regime shifts from bubble boiling to film boiling, causing a considerable increase in wall temperature.
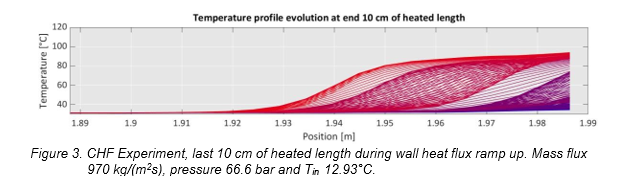
Figure 3 displays the typical evolution of the outer wall temperature profile on the last 10 cm of the heated length during a CHF experiment. Note, that the profiles shown are truncated to the position of
1.99 m (the last 1.0 cm not shown) as the evaluation of the results suggested that the accuracy of the measurement by the OFDR system was affected by the discontinuity in heat flux at the end of the heated length. Profiles are shown in time increments of 1.25 seconds for an interval of 16 minutes and 30 seconds during which the heat flux was gradually ramped up from 98 kW/(m2s) to 101.8 kW/(m2s). The blue color indicates the start of the experiment and blends into red, representing the end of the experiment. The start of the temperature rise marks the point where the critical heat flux was exceeded.
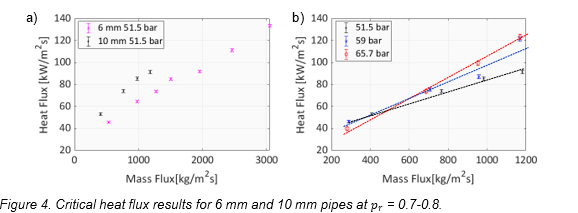
Figure 4 summarizes results from CHF experiments at different pressures and mass fluxes conducted in the test sections with 6 mm and 10 mm pipe. All the experiments were conducted with 𝑇𝑖𝑛=13°C. The indicated heat fluxes correspond to the points where the critical heat flux was detected according to the procedure described above. Figure 4a) illustrates the influence of mass flux and pipe diameter on CHF at 𝑝𝑟=0.7. The CHF values for the 6 mm pipe remain below those for the corresponding mass fluxes for the 10 mm pipe, indicating superior CHF performance for larger tube diameters. The data point with the largest mass flux for the 10 mm tube seems to indicate a deviation from the trend of the previous points. Unfortunately, this deviation could not be further investigated since in the present facility the maximum mass flow rate limits the mass flux to 1200 kg/(m²s) in the case of the 10 mm tube. Figure 4b shows the effect of pressure and mass flux on CHF for the 10mm pipe. The trends with increasing mass flux are indicated by the dashed lines which are linear fits to the data at 𝑝𝑟=0.7, 𝑝𝑟=0.75 and 𝑝𝑟=0.8. They show that the increase in CHF with increasing mass flux is steeper with higher pressures.
In Post-CHF experiments, the heating power started at the value applied when CHF was detected and was subsequently raised incrementally by adjusting the electric current. Unlike in CHF experiments, intervals with constant power were prolonged until steady-state conditions were reached, confirmed by pressure fluctuations below ±0.02 MPa, inlet temperature fluctuations below ±0.2 °C and stabilized wall temperature. Once steady-state was attained, measurements were averaged over five minutes before advancing to the next power level.
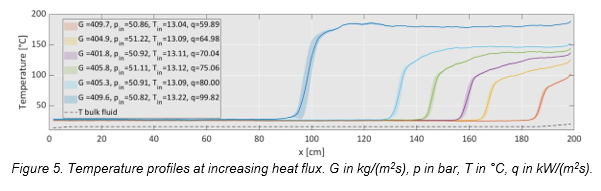
Figure 5 presents wall temperature profiles that develop for varying levels of heating obtained in such experiments in 10mm tube. The position of characteristic steep temperature increase corresponds to the CHF point, i.e. the CHF conditions (quality, pressure, etc.) have to be taken as the local conditions at the position of the jump, which defines a “virtual” end of the heated length. At lower heat fluxes, the post-steep increase profiles exhibit an inclined shape, suggesting the presence of droplets cooling the heated pipe’s wall. As the heat flux increases, the temperature rise at the CHF position becomes more
pronounced, resulting in a flat profile at the maximum temperature. This indicates the establishment of a stable vapor layer on the wall, minimizing the influence of droplets. This behaviour is typical at low mass fluxes and suggests dryout mechanism of CHF. At the highest heat flux, beyond the CHF position, the wall reaches its peak temperature between 110 and 125 cm. Subsequently, the wall temperature decreases and maintains a flat profile until the CO2 attains a superheated state, initiating a subsequent rise in wall temperature. Such change may be connected to change of CHF mechanism from dryout to DNB.
Conclusions
In the experimenal investigation of CHF steady-state conditions were established with pressure and temperature criteria before gradually increasing heating power. The transition from bubble boiling to film boiling was observed, causing a significant rise in wall temperature. From experiments in 6 mm and 10 mm pipes at different pressures revealed an approximately linear correlation between CHF and mass flux for 6 mm, while 10 mm showed slowed growth. In 10 mm pipes, CHF performance at 𝑝𝑟=0.8 surpassed that at 𝑝𝑟=0.7, maintaining a linear correlation. 𝑝𝑟=0.75 exhibited intermediate performance.
The experimental setup allows for detailed observation of wall temperature evolution along the heated length of the pipe without missing local information about temperature profile and heat transfer behaviour.
References
- Yu, F. Feuerstein, L. Köckert, X. Cheng, “Analysis and modelling of post-dryout heat transfer in upward vertical flow” Annals of Nuclear Energy, Vol. 115, pp 186-194 (2018).
- B. Marchetto, D.C. Moreira, R. Revellin, G. Ribatski, “A state-of-the-art review on flow boiling at high reduced pressures”, International Journal of Heat and Mass Transfer, Vol. 193, 2022
- Q. Song, X. J. Liu, X. Cheng, “Heat transfer analysis of trans-critical pressure transient” Annual Meeting of Nuclear Engineering, Berlin, Germany, May 7-8, 2019.
- Flaig, R. Mertz, J. Starflinger, “Setup of the supercritical CO2 test facility “SCARLETT” for basic experimental investigations of a compact heat exchanger for an innovative decay heat removal system”, Journal of Nuclear Engineering and Radiation Science, Vol. 4, July 2018.
- K. Sang, M.E. Froggatt, D.K. Gifford, S.T. Kreger, B.D. Dickerson, “One Centimeter Spatial Resolution Temperature Measurements in a Nuclear Reactor Using Rayleigh Scatter in Optical Fiber”. IEEE Sensors Journal, Vol. 8, pp 1375–1380, 2008.
- Luna Innovations Incorporated, “Distributed Fiber Optic Sensing: Temperature Coefficient for Polyimide Coated Low Bend Loss Fiber, in the 10°C – 80°C Range”, Blacksburg, 2014.
- W. Lemmon, M. L. Huber, M. O. McLinden, REFPROP, NIST SRD 23, USA, 2010
- P. Incropera, D. P. DeWitt; T. L. Bergman; A. S. Lavine, Principles of heat and mass transfer, p.152, 7. ed., Wiley, Singapore (2013).
Acknowledgements
The presented work was funded by the German Federal Ministry of Education and Research (BMBF) under contract no. 02NUK062B on basis of a decision by the German Bundestag. The authors are however responsible for the scientific content.
0 Comments